How the numbers are made.
Wasser is built entirely on open, citable datasets and standard engineering methods. This page states exactly what each number is, where it comes from, and where it stops being reliable — so you can defend anything you take from this platform.
Coastal flood hazard
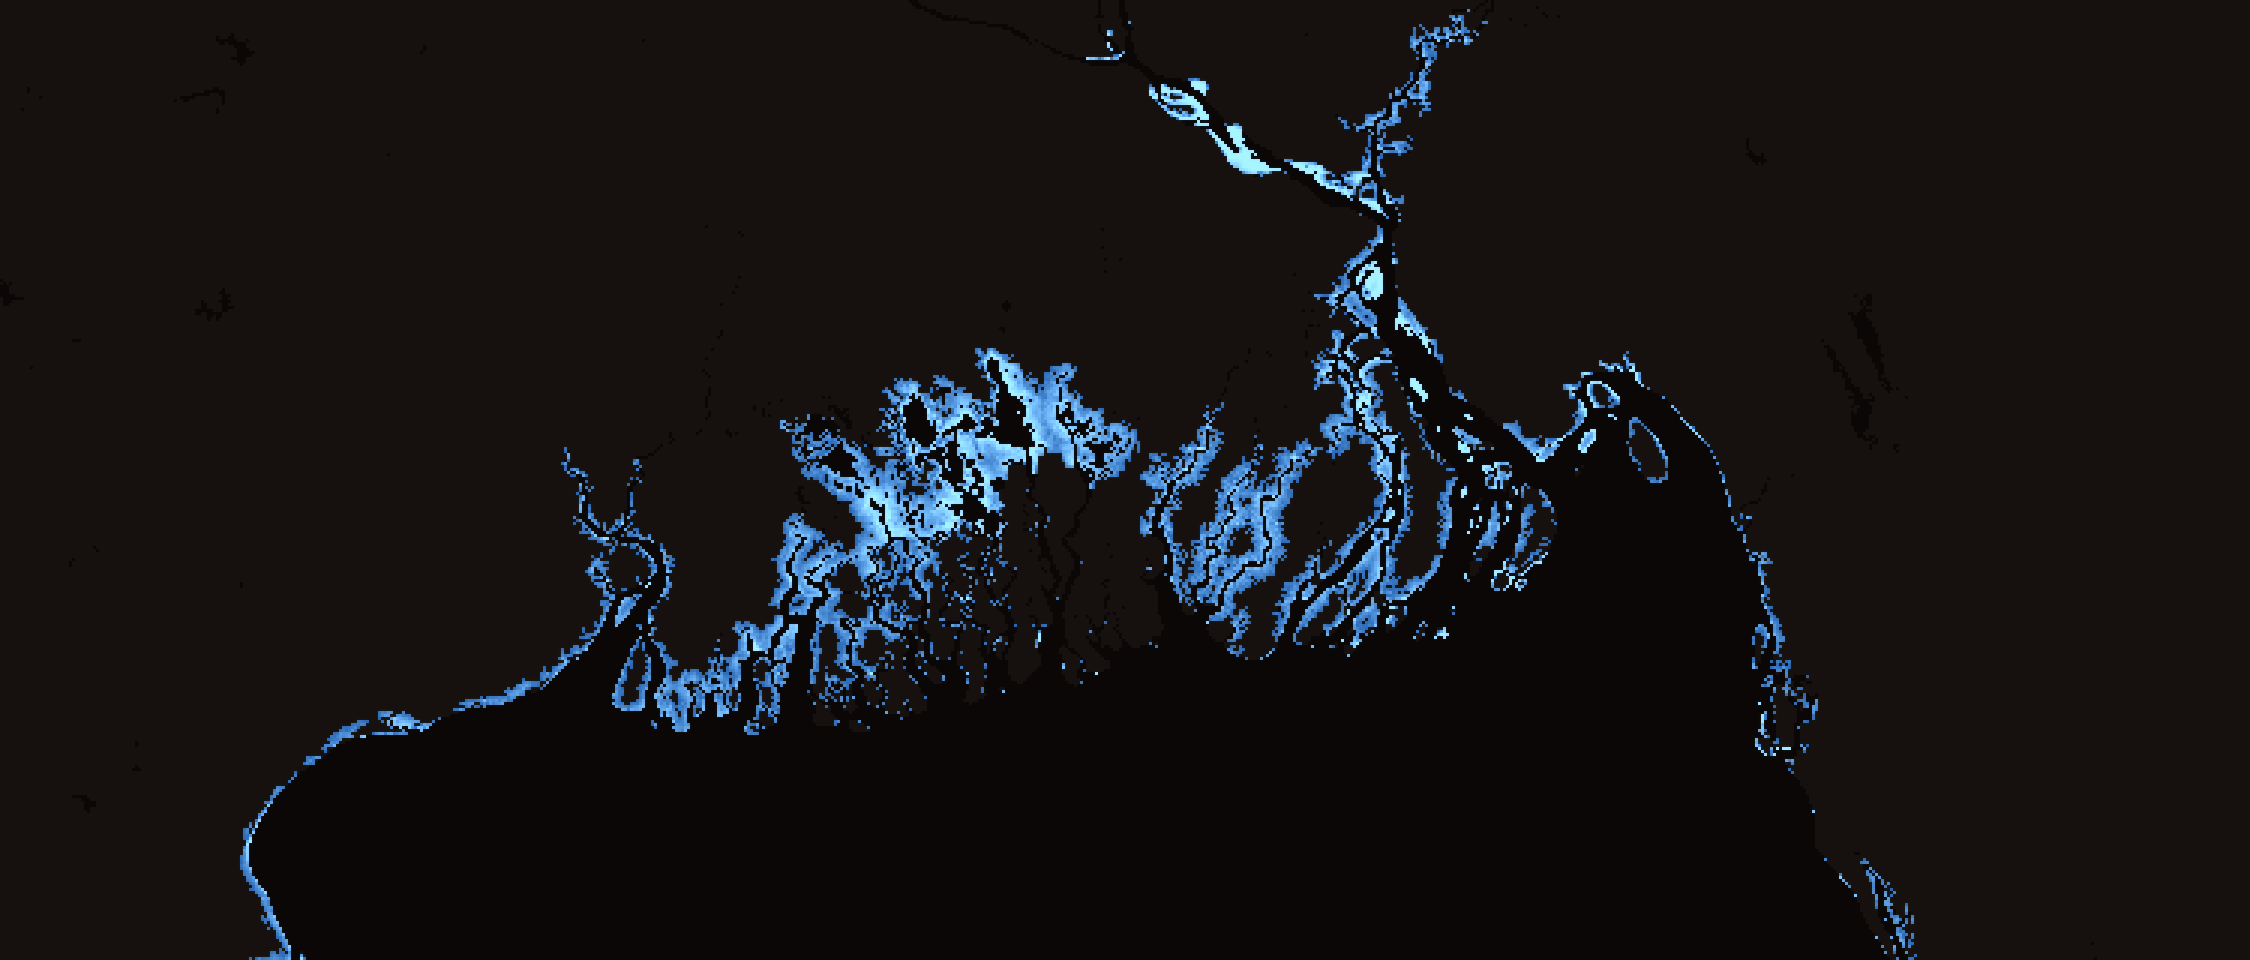
Flood depths come from the Deltares Global Flood Maps (v2021.06). Extreme sea levels — surge plus tide from the GTSM model — are extended overland across NASADEM terrain using a bathtub method with an attenuation factor of 0.5 m per km, at ~1 km resolution. We serve seven return periods (1-in-2 to 1-in-250 years) for two sea-level years: 2018 and 2050. The rasters are pre-clipped to South Asia and the Gulf and self-hosted inside our service, so the atlas does not depend on any external data host.
This layer is coastal only. River (fluvial) and rainfall (pluvial) flooding are not represented in the atlas map — inland flood risk for a specific site is addressed by the screening tool below.
Population at risk
People-at-risk figures overlay WorldPop 2020 population grids (~1 km) with the 1-in-100-year coastal flood layer: every populated cell with modeled depth > 0 counts its full population as exposed. Totals are precomputed per country for both sea-level years. This is a screening estimate — it does not model defenses, evacuation or within-cell population placement.
Country exposure statistics
Flooded fraction, area and depth statistics are computed live against each country’s national polygon — neighbouring countries are masked out — at the native ~1 km cell size, with cell areas corrected for latitude.
Site screening hydrology
The screening tool derives a composite SCS curve number for your drawn boundary from the GCN250 global grid (250 m, antecedent moisture classes I/II/III), cross-checked against Sentinel-2 land cover and SoilGrids-derived hydrologic soil groups. Terrain and time of concentration come from the SRTM DEM. Design rainfall uses regionally calibrated IDF relationships for India, Saudi Arabia and the UAE, reduced by an areal reduction factor and shaped into an alternating-block hyetograph, with an optional climate-change uplift. Peak flows follow the SCS-CN runoff method. Every intermediate value — CN, Tc, rainfall depths, hydrograph ordinates — is shown in the report, so the calculation can be audited line by line.
Sources and licensing
| Layer | Source | License |
|---|---|---|
| Coastal flood depth | Deltares Global Flood Maps v2021.06 — NASADEM, ~1 km | CC BY 4.0 |
| Population | WorldPop 2020, ~1 km per-country grids | CC BY 4.0 |
| Curve number | GCN250 (Jaafar, Ahmad & El Beyrouthy 2019), 250 m | CC BY 4.0 |
| Land cover | Sentinel-2 derived classification (per run) | Open access |
| Soil hydrology | SoilGrids-derived hydrologic soil groups | CC BY 4.0 |
| Terrain | SRTM ~30 m digital elevation model | Public domain |
Limitations
Everything here is screening-grade orientation. The hazard cells are ~1 km — a “dry” reading does not clear a site, and a “wet” one does not condemn it. Flood defenses, urban drainage networks and river flooding are not modeled in the atlas. None of this platform’s output is a hydraulic model, a design basis or an approval document: decisions that carry risk should be confirmed with a calibrated site study — which is exactly the work Archeve does.